Fig. 3
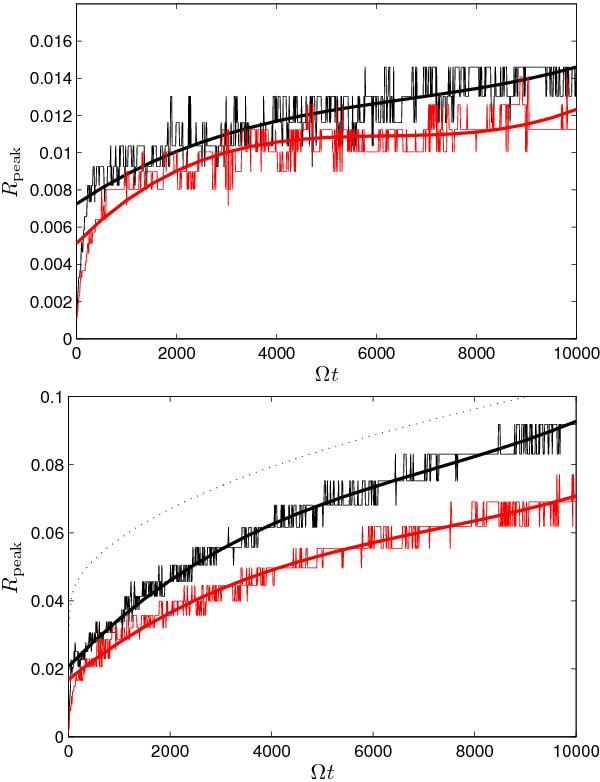
Maximum of the distribution function as the time increases. Again the cases of RA = 10-4 (upper panel) and RA = 10-3 (lower panel) are shown. The black and red lines denote the cases of single injection and continuous particle injection, respectively. The thick lines simply show cubic fits of the actual simulation data. Additionally, the average particle rigidity is shown in the lower panel (dotted line). (This figure is available in color in electronic form.)
Current usage metrics show cumulative count of Article Views (full-text article views including HTML views, PDF and ePub downloads, according to the available data) and Abstracts Views on Vision4Press platform.
Data correspond to usage on the plateform after 2015. The current usage metrics is available 48-96 hours after online publication and is updated daily on week days.
Initial download of the metrics may take a while.