Fig. 2
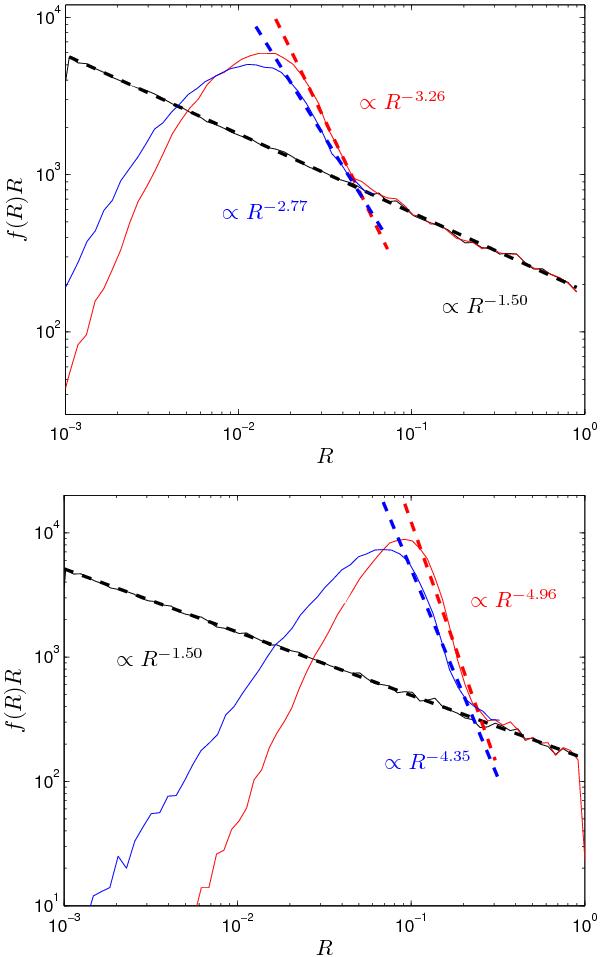
Energy spectral index for the cases of RA = 10-4 (upper panel) and RA = 10-3 (lower panel). Shown is the energy distribution function at the beginning (black lines) and at the end of the simulation for the cases of single injection (red lines) and continuous particle injection (blue lines). Also shown are the spectral indices obtained from power-law fits (dashed lines) to the simulation data (thin lines). (This figure is available in color in electronic form.)
Current usage metrics show cumulative count of Article Views (full-text article views including HTML views, PDF and ePub downloads, according to the available data) and Abstracts Views on Vision4Press platform.
Data correspond to usage on the plateform after 2015. The current usage metrics is available 48-96 hours after online publication and is updated daily on week days.
Initial download of the metrics may take a while.