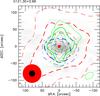
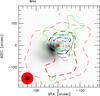
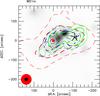
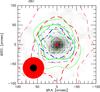
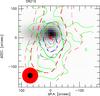
Fig. 2
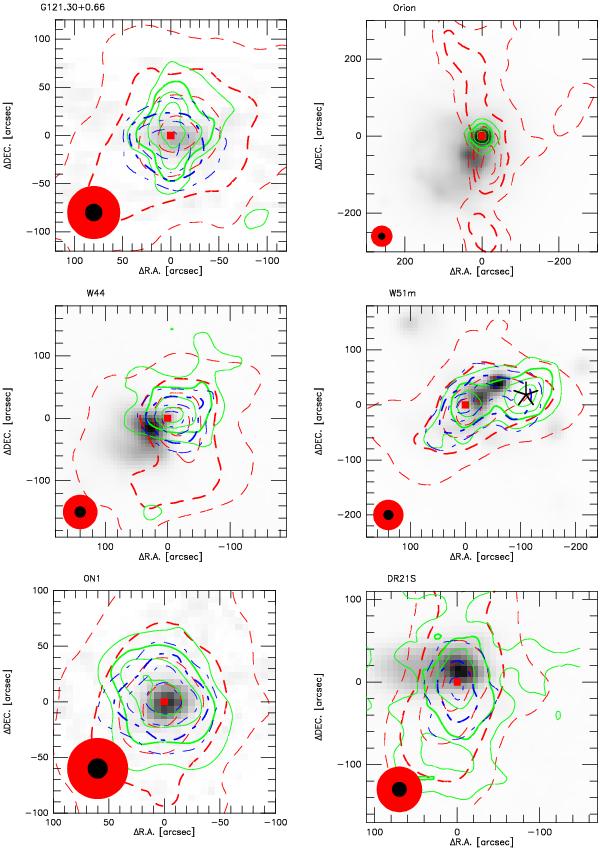
Contour maps of HNCO (green solid line), HC3N (blue dotted line), and C18O (red dashed line) superimposed on the MSX 21.3 μm image for observing sources. The contour levels are 30%, 50%, 70%, and 90% of the map peak, reported in Table 3 (see Col. 3 for HNCO, Col. 7 for C18O, see Col. 3 in Table 3 of Li et al. (2012) for HC3N). The heavy lines represent 50% of the map peak. “⋆” is used to mark the position of the AKARI FIR source. “∗” is used to mark the position of the AKARI MIR source in S140. Red filled squares are used to mark the position of water masers. The FWHM beam size for molecular lines (the big, red circle) and mid-infrared (the small, black circle) observations are shown in the lower left of the maps. (A color version of this figure is available in the online journal.)

Current usage metrics show cumulative count of Article Views (full-text article views including HTML views, PDF and ePub downloads, according to the available data) and Abstracts Views on Vision4Press platform.
Data correspond to usage on the plateform after 2015. The current usage metrics is available 48-96 hours after online publication and is updated daily on week days.
Initial download of the metrics may take a while.