Free Access
Fig. 21
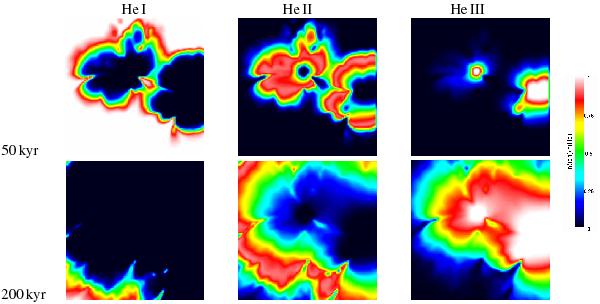
For the same simulation as in Fig. 20 cross-sections through the center, which display the relative abundances of the ionization stages of helium, are shown after 50 kyr and 200 kyr.
Current usage metrics show cumulative count of Article Views (full-text article views including HTML views, PDF and ePub downloads, according to the available data) and Abstracts Views on Vision4Press platform.
Data correspond to usage on the plateform after 2015. The current usage metrics is available 48-96 hours after online publication and is updated daily on week days.
Initial download of the metrics may take a while.