Fig. 4
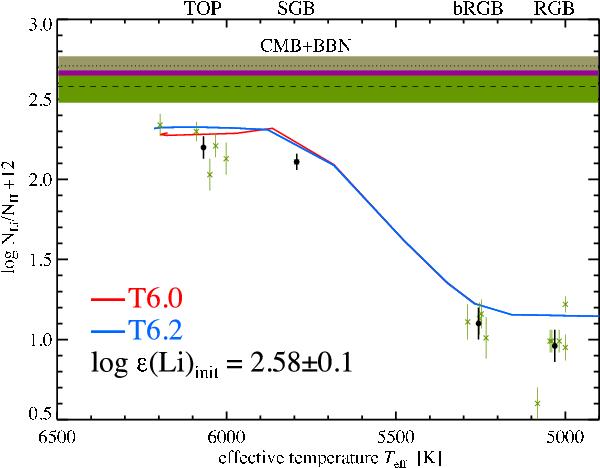
Observed abundance trends with evolutionary stage of lithium. Green crosses indicate individual stellar abundances, while bullets represents the abundance derived from the co-added spectra within each group as a function of Teff. Solid lines represent predictions from stellar evolution models including AD and AddMix with two different efficiencies, at 13.5 Gyr. The blue curve represents high-efficiency mixing (T0 = 6.20) while the red curve corresponds to low-efficiency mixing (T0 = 6.00). The dashed line gives the original Li abundance for the mean of our two highest detected Li abundances following the AD model with AddMix parameterised by T0 = 6.20, log ε(Li) = 2.58 ± 0.1. The dotted line with the olive-brown shaded area shows the predicted primordial lithium abundance (“CMD+BBN”: log ε(Li) = 2.71 ± 0.06; Cyburt et al. 2010). The purple shaded area represent the overlapping 1-σ uncertainties between the two values. (This figure is available in colour in electronic form.)
Current usage metrics show cumulative count of Article Views (full-text article views including HTML views, PDF and ePub downloads, according to the available data) and Abstracts Views on Vision4Press platform.
Data correspond to usage on the plateform after 2015. The current usage metrics is available 48-96 hours after online publication and is updated daily on week days.
Initial download of the metrics may take a while.