Fig. 2
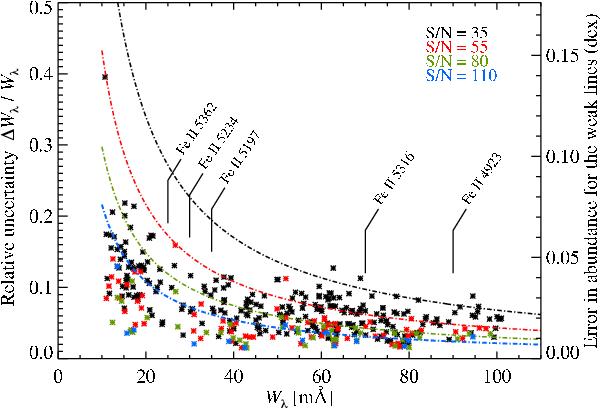
Relative uncertainty in EW in function of line strength for different S/N. The line strengths of our five Fe II lines in the TOP stars are also indicated in the plot. The dot-dashed lines represent the theoretical errors in EW following Norris et al. (2001) at λ = 5600 Å. On the right axis the corresponding uncertainties in abundance for weak lines are given. (This figure is available in colour in electronic form.)
Current usage metrics show cumulative count of Article Views (full-text article views including HTML views, PDF and ePub downloads, according to the available data) and Abstracts Views on Vision4Press platform.
Data correspond to usage on the plateform after 2015. The current usage metrics is available 48-96 hours after online publication and is updated daily on week days.
Initial download of the metrics may take a while.