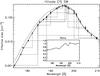
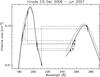
Fig. 8
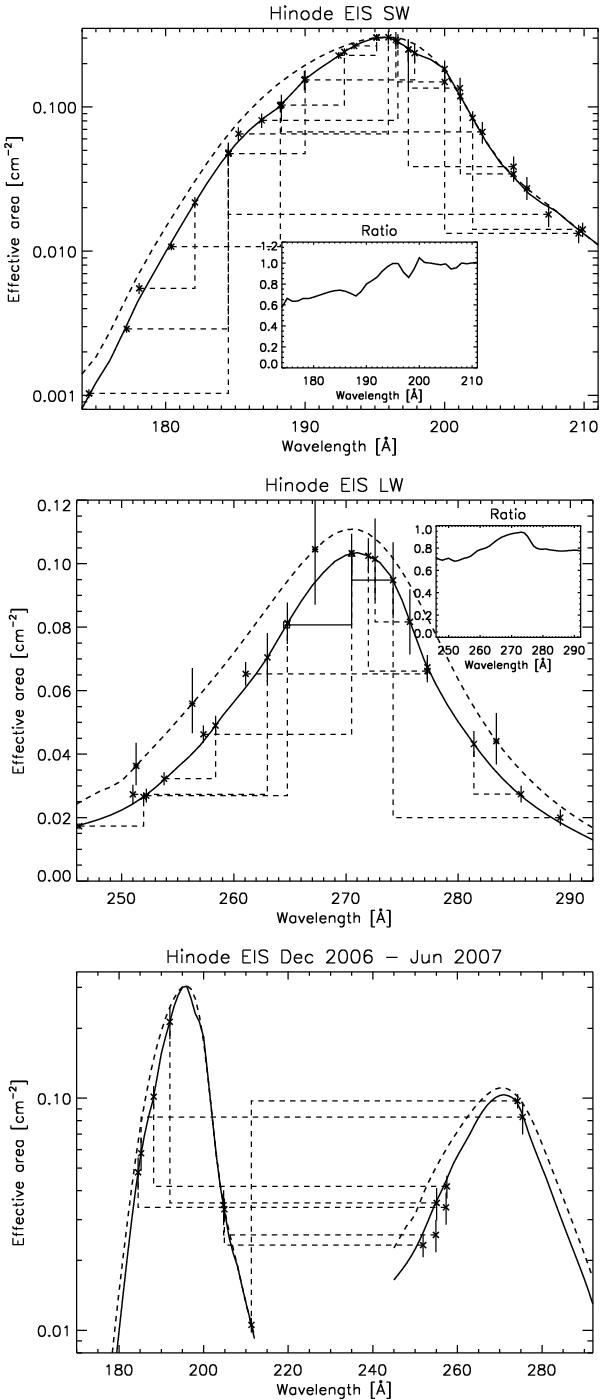
Effective areas for the EIS channels obtained from the first two years of QS and AR observations analysed here, and the 2007 Jun. 2 flare observation (Del Zanna 2008). The full lines indicate the proposed values, the dashed lines those from the ground calibration. The top two plots show the line ratios used for the SW and LW channels separately, while the bottom plot shows the cross-channel line ratios. The asterisks show the five measurements of the ground calibration. The insets show the ratios between the measured values and those of the ground calibration.

Current usage metrics show cumulative count of Article Views (full-text article views including HTML views, PDF and ePub downloads, according to the available data) and Abstracts Views on Vision4Press platform.
Data correspond to usage on the plateform after 2015. The current usage metrics is available 48-96 hours after online publication and is updated daily on week days.
Initial download of the metrics may take a while.