Fig. 13
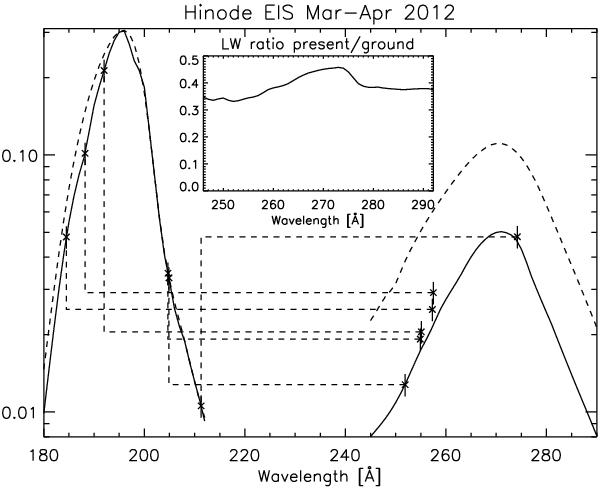
Effective areas for the EIS channels obtained with the first-order calibration for the period 2012 Mar.–Apr. The full lines indicate the proposed values, the dashed lines those from the ground calibration. The ratios of the effective areas as obtained from the off-limb AR observation of 2012 Apr. 16 and the flare observation of 2012 Mar. 9 are overplotted, showing good agreement.
Current usage metrics show cumulative count of Article Views (full-text article views including HTML views, PDF and ePub downloads, according to the available data) and Abstracts Views on Vision4Press platform.
Data correspond to usage on the plateform after 2015. The current usage metrics is available 48-96 hours after online publication and is updated daily on week days.
Initial download of the metrics may take a while.