Free Access
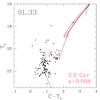
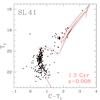
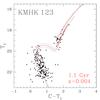
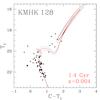
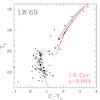
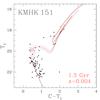
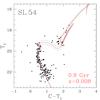
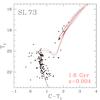
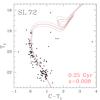
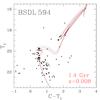
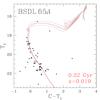
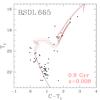
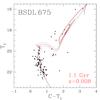
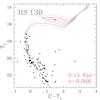
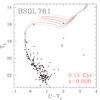
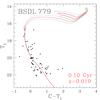
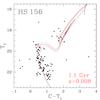
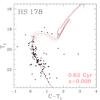
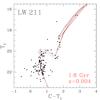
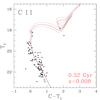
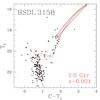
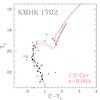
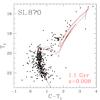
Fig. 7
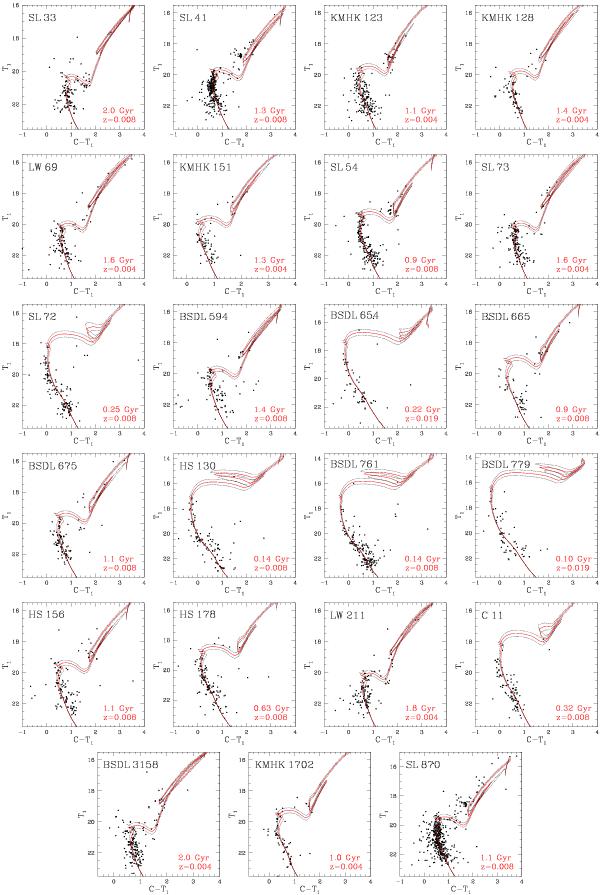
Cleaned Washington (T1,C − T1) CMDs for the studied clusters. Isochrones from Girardi et al. (2002), computed taking into account overshooting, are overplotted. The red solid and black dashed lines correspond to the derived cluster age and to the ages of the nearest younger and older isochrones.
This figure is made of several images, please see below:
Current usage metrics show cumulative count of Article Views (full-text article views including HTML views, PDF and ePub downloads, according to the available data) and Abstracts Views on Vision4Press platform.
Data correspond to usage on the plateform after 2015. The current usage metrics is available 48-96 hours after online publication and is updated daily on week days.
Initial download of the metrics may take a while.