Free Access
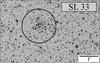
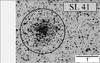
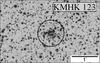
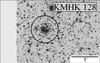
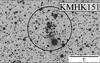
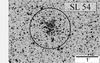
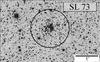
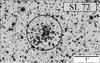
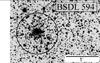
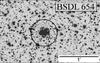
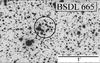
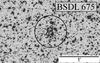
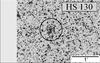
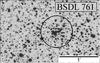
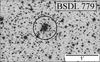
Fig. 4
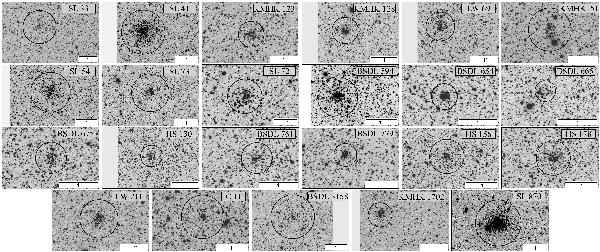
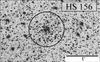
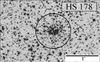
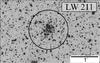
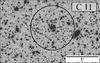
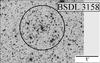
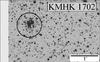
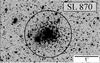
Schematic images of the stars observed in the fields of our target clusters. North is up and east is to the left. The circle in each figure has been drawn with the same radius (in pixels) as the radius obtained for each cluster.
This figure is made of several images, please see below:

Current usage metrics show cumulative count of Article Views (full-text article views including HTML views, PDF and ePub downloads, according to the available data) and Abstracts Views on Vision4Press platform.
Data correspond to usage on the plateform after 2015. The current usage metrics is available 48-96 hours after online publication and is updated daily on week days.
Initial download of the metrics may take a while.