Free Access
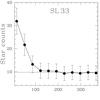
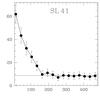
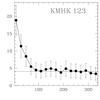
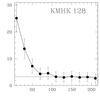
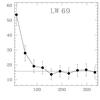
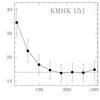
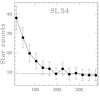
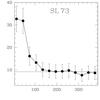
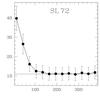
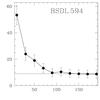
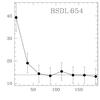
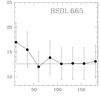
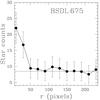
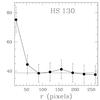
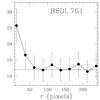
Fig. 3
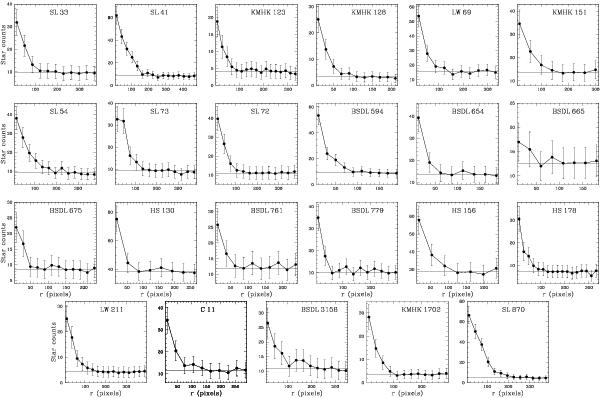
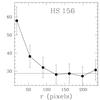
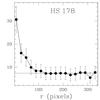
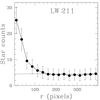
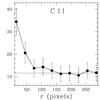
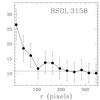
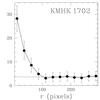
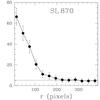
Stellar density profiles for the selected clusters, with the Poisson errors included. The horizontal lines correspond to the background levels far from the clusters. The background level was determined by estimating the mean stellar density at distances larger than ~ 300 pixels from the centre of each cluster.
This figure is made of several images, please see below:

Current usage metrics show cumulative count of Article Views (full-text article views including HTML views, PDF and ePub downloads, according to the available data) and Abstracts Views on Vision4Press platform.
Data correspond to usage on the plateform after 2015. The current usage metrics is available 48-96 hours after online publication and is updated daily on week days.
Initial download of the metrics may take a while.