Fig. 7
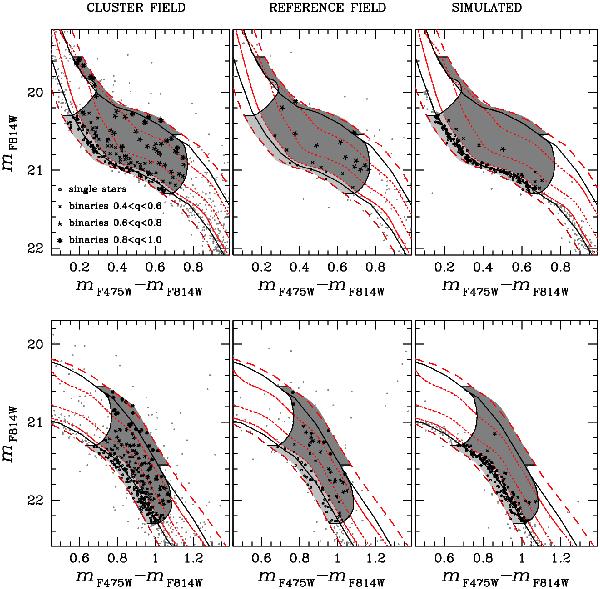
CMD of stars in the cluster field (left), the comparison field (middle), and simulated stars (right). The continuous black lines are the MS fiducials and the locus of equal-mass binaries, while the loci of binaries with mass ratio q = 0.4, 0.6, and 0.8 are represented with dotted red lines (see text for more details). Upper and lower panels show the setup used to measure the fraction of binaries in the intervals 20.3 < mF814W < 21.3 and 21.3 < mF814W < 22.3 respectively.
Current usage metrics show cumulative count of Article Views (full-text article views including HTML views, PDF and ePub downloads, according to the available data) and Abstracts Views on Vision4Press platform.
Data correspond to usage on the plateform after 2015. The current usage metrics is available 48-96 hours after online publication and is updated daily on week days.
Initial download of the metrics may take a while.