Fig. 5
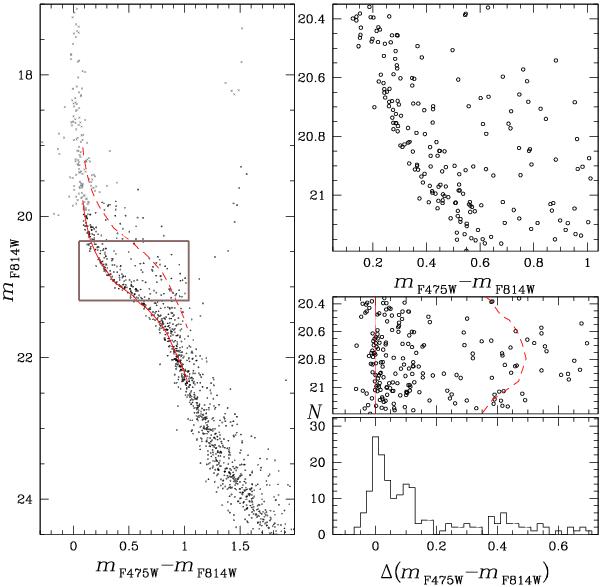
On the left, the mF814W vs. mF475W − mF814W CMD for stars in the cluster field. Saturated stars are colored gray. The solid and the dashed lines are the MS ridge line and the locus of equal-mass binaries, respectively. On the right, a zoom-in of the same CMD in the region highlighted by the box, i.e. where the MS broadening is most clearly visible (upper panel), the verticalized CMD (middle panel), and the color histogram distribution (lower panel) (see text).
Current usage metrics show cumulative count of Article Views (full-text article views including HTML views, PDF and ePub downloads, according to the available data) and Abstracts Views on Vision4Press platform.
Data correspond to usage on the plateform after 2015. The current usage metrics is available 48-96 hours after online publication and is updated daily on week days.
Initial download of the metrics may take a while.