Fig. 9
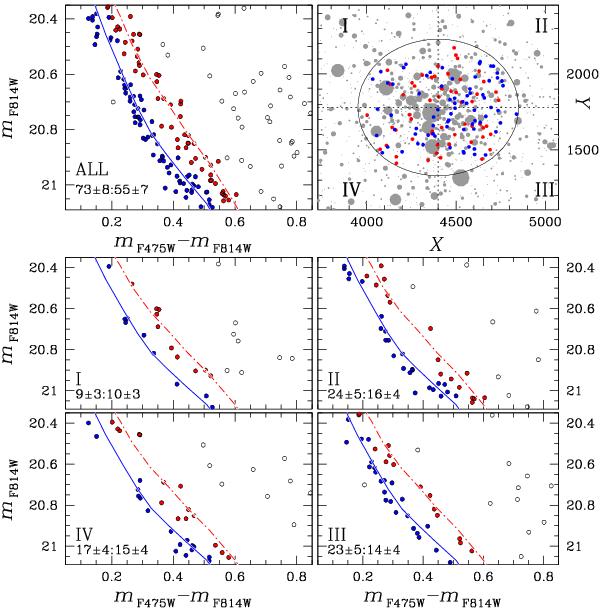
Upper-left panel: CMD of stars in the cluster field zoomed-in around the region where the MS broadening is more evident. Stars on the blue and the red MS side are color coded in blue and red, respectively. The continuous and the dashed-dotted lines are the fiducial of the two MS regions drawn by hand. Upper-right panel: spatial distribution of blue and red MS stars. Lower panels: CMDs for stars in the four quadrants defined in the upper-right panel.
Current usage metrics show cumulative count of Article Views (full-text article views including HTML views, PDF and ePub downloads, according to the available data) and Abstracts Views on Vision4Press platform.
Data correspond to usage on the plateform after 2015. The current usage metrics is available 48-96 hours after online publication and is updated daily on week days.
Initial download of the metrics may take a while.