Free Access
Fig. 4
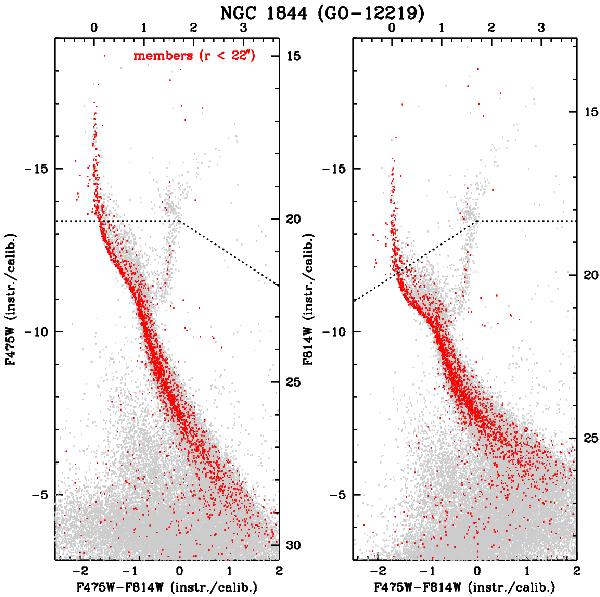
CMDs for all the sources in the field (gray points). The objects within 22 arcsec from the assumed cluster center are shown as red dots. A dashed line indicates the set in of the saturations.
Current usage metrics show cumulative count of Article Views (full-text article views including HTML views, PDF and ePub downloads, according to the available data) and Abstracts Views on Vision4Press platform.
Data correspond to usage on the plateform after 2015. The current usage metrics is available 48-96 hours after online publication and is updated daily on week days.
Initial download of the metrics may take a while.