Fig. 9
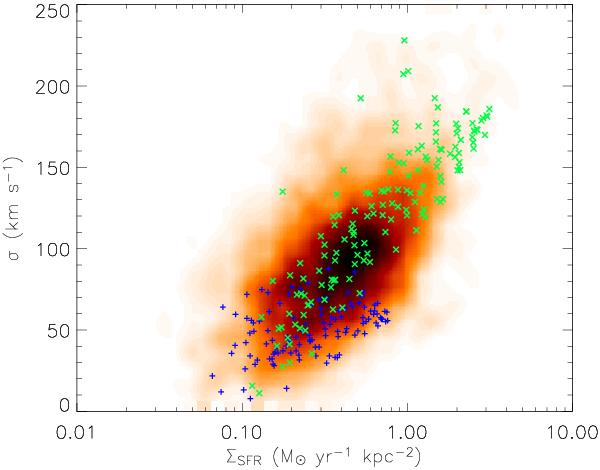
Normalized 2-dimensional histogram of the frequency of occurrence in the data set of Hα line widths as function of star formation rate intensity. The set of points for each galaxy are normalized such that all of the galaxies have the same mean star-formation rate intensity (their distribution of the velocity dispersion in each galaxy is unaffected). The mean value was chosen to match the mean value of the star-formation intensity in the model with σ = (ϵΣSFR)1/2 as indicated by the red + sign in the right panel of Fig. 8 (~0.5 M⊙ yr-1 kpc-2). As in Fig. 2, the darkest regions represent the highest frequency of occurrence in the data set. The green × and blue + symbols represent our simulated data after beam smearing, assuming that the two quantities plotted are related as σ = (ϵΣSFR)1/2 and σ = σsim, respectively.
Current usage metrics show cumulative count of Article Views (full-text article views including HTML views, PDF and ePub downloads, according to the available data) and Abstracts Views on Vision4Press platform.
Data correspond to usage on the plateform after 2015. The current usage metrics is available 48-96 hours after online publication and is updated daily on week days.
Initial download of the metrics may take a while.