Fig. 8
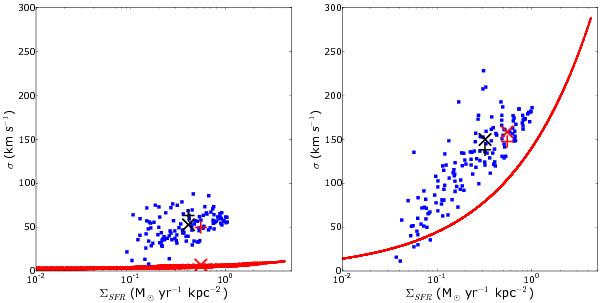
In our analysis of the impact of beam smearing on the velocity dispersion and
star-formation intensity, we adopted two relationshipsbetween these two quantities.
One taken directly from the simulations (left panel), and another
where we assumed  (right panel). The model velocity dispersions are shown in red
(these are not lines but many individual points). We also show the points (blue)
after analyzing the artificial data cubes derived from the simulation which include
the effects of beam smearing. The red + (red × ) sign indicates the mean
star-formation intensity and integrated (original input) velocity dispersion for the
intrinsic relation between velocity dispersion and star-formation intensity, while
the black + (black × ) sign has the same meaning but now for the beam-smeared
relationship.
(right panel). The model velocity dispersions are shown in red
(these are not lines but many individual points). We also show the points (blue)
after analyzing the artificial data cubes derived from the simulation which include
the effects of beam smearing. The red + (red × ) sign indicates the mean
star-formation intensity and integrated (original input) velocity dispersion for the
intrinsic relation between velocity dispersion and star-formation intensity, while
the black + (black × ) sign has the same meaning but now for the beam-smeared
relationship.
Current usage metrics show cumulative count of Article Views (full-text article views including HTML views, PDF and ePub downloads, according to the available data) and Abstracts Views on Vision4Press platform.
Data correspond to usage on the plateform after 2015. The current usage metrics is available 48-96 hours after online publication and is updated daily on week days.
Initial download of the metrics may take a while.