Fig. 6
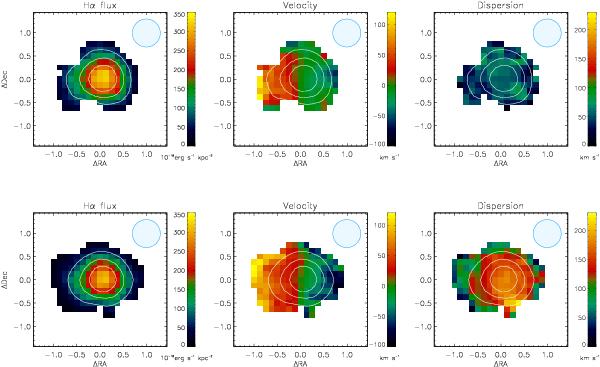
Results of the simulated data sets of a star-forming disk galaxy at
z = 2 after beam smearing using different relationships for the
velocity dispersions. Shown are the distribution of the Hα surface
brightness (left), velocity field (middle) and
velocity dispersion map (right). In the upper row,
we have simply taken the velocity dispersions as estimated from the
N-body/SPH simulation, while for the lower row
we assumed a relationship between the velocity dispersion and
star-formation intensity of the form  km s-1.
The circle in the upper right of each plot represents the FWHM of the PSF used to
make the artificial data set. The scales are in arcsec. We note that we have scaled
the images such that the sizes of these panels and those in Fig. 5 are similar, for ease of direct comparison.
km s-1.
The circle in the upper right of each plot represents the FWHM of the PSF used to
make the artificial data set. The scales are in arcsec. We note that we have scaled
the images such that the sizes of these panels and those in Fig. 5 are similar, for ease of direct comparison.
Current usage metrics show cumulative count of Article Views (full-text article views including HTML views, PDF and ePub downloads, according to the available data) and Abstracts Views on Vision4Press platform.
Data correspond to usage on the plateform after 2015. The current usage metrics is available 48-96 hours after online publication and is updated daily on week days.
Initial download of the metrics may take a while.