Fig. 2
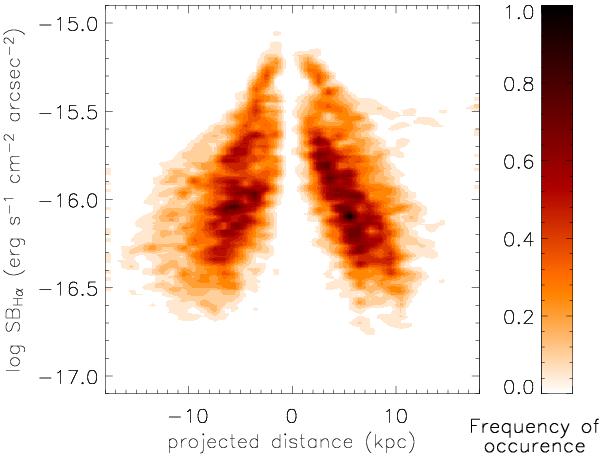
Two-dimensional histogram of the frequency of occurrence of pixel values of Hα surface brightness versus projected physical distance for the entire sample. As shown in the color bar, the darkest regions have the highest frequency of occurrence. The surface brightness has not been corrected for cosmological dimming. The zero of the projected distance was chosen to be the symmetry point in either the Hα velocity field or of 3σ isophotes in the Hα surface brightness map.
Current usage metrics show cumulative count of Article Views (full-text article views including HTML views, PDF and ePub downloads, according to the available data) and Abstracts Views on Vision4Press platform.
Data correspond to usage on the plateform after 2015. The current usage metrics is available 48-96 hours after online publication and is updated daily on week days.
Initial download of the metrics may take a while.