Fig. 13
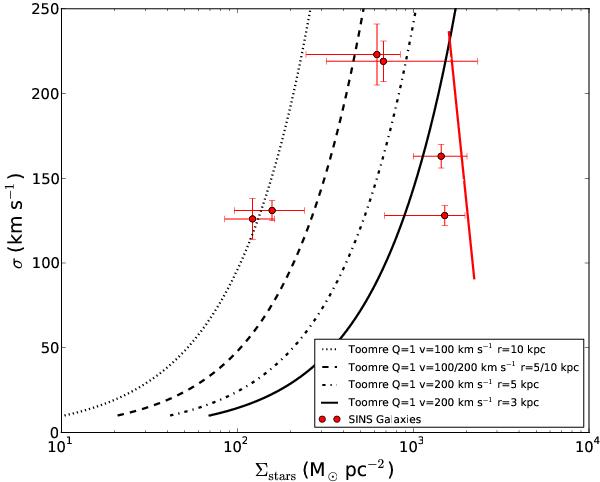
Hα velocity dispersion, σ as function of stellar mass surface density, Σstars (M⊙ pc-2). The lines represent the Toomre criterion Q = 1 for two rotation speeds (v = 100 or 200 km s-1) and three radii (r = 3, 5, 10 kpc), as indicated in the legend. These values span the range of radii and velocity shears observed in these galaxies (Förster Schreiber et al. 2006, 2009). The stellar mass surface densities (red dots) are estimates within one effective radius for 6 galaxies in our sample with NICMOS images (see text). The red solid line shows the relationship between central velocity dispersion and stellar mass surface density for local early-type galaxies (Shen et al. 2003; Taylor et al. 2010).
Current usage metrics show cumulative count of Article Views (full-text article views including HTML views, PDF and ePub downloads, according to the available data) and Abstracts Views on Vision4Press platform.
Data correspond to usage on the plateform after 2015. The current usage metrics is available 48-96 hours after online publication and is updated daily on week days.
Initial download of the metrics may take a while.