Fig. 12
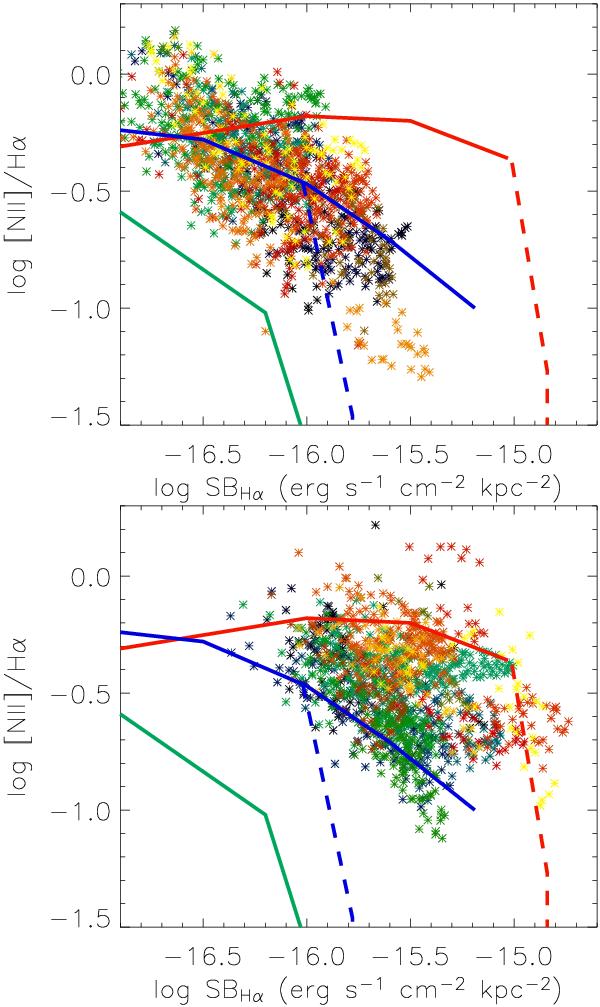
Hα surface brightness (corrected for cosmological surface brightness dimming) versus the logarithm of the [Nii]λ6583/Hα line ratio. The galaxies have been separated into two redshift bins: z < 1.8 (top) and z > 2 (bottom). The lines represent results for photo-ionization modeling (see text for details) for 6 sets of conditions: a range of hydrogen densities, log nH (cm-3) = 1 (in green), 2 (blue) and 3 (red), and of column densities, log NH (cm-2) = 21 (solid lines) and 20 (dashed lines). The ionization parameters range from log U = −5 to −1 (increasing from left to right along the lines, meaning low ionization parameters have relatively high log [Nii]/Hα and low Hα surface brightnesses). At low ionization parameters the solid and dashed lines for the column densities overlap until the lower column density cloud becomes density bounded, at which point the models reach very low ratios of [Nii]λ6583/Hα (as shown by the sharply dropping dotted lines). For clarity, we only show the log NH (cm-2) = 21 and log nH (cm-3) = 3 line until log U = −3 and for log NH (cm-2) = 21 and log nH (cm-3) = 2 until log U = −2.
Current usage metrics show cumulative count of Article Views (full-text article views including HTML views, PDF and ePub downloads, according to the available data) and Abstracts Views on Vision4Press platform.
Data correspond to usage on the plateform after 2015. The current usage metrics is available 48-96 hours after online publication and is updated daily on week days.
Initial download of the metrics may take a while.