Fig. 11
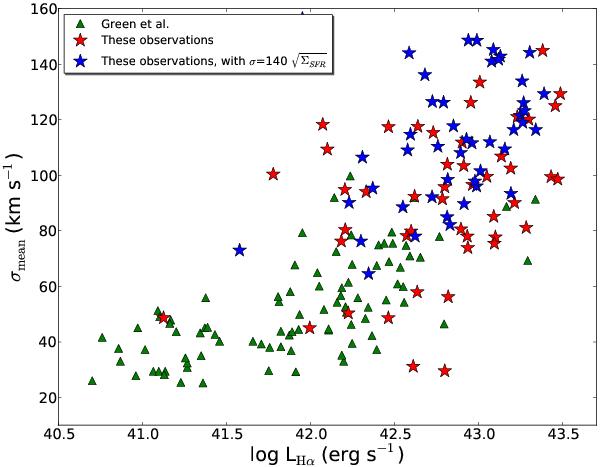
Mean Hα line velocity dispersion, σmean
(in km s-1), versus total Hα luminosity (in erg
s-1) for different samples of local and high redshift galaxies. Local
galaxies (green triangles) are taken from Green et al.
(2010) and the model results for our sample are represented by red and blue
stars. The blue stars show the results where we assign to each pixel in a galaxy an
Hα surface brightness based on the model relationship,
 km s-1
and use the observed local Hα velocity dispersion. We then estimate
the total Hα luminosity by summing up the predicted pixel-by-pixel
surface brightnesses, and estimate σmean by weighting the
pixel-by-pixel velocity dispersion measurements by the Hα surface
brightnesses derived from the model.
km s-1
and use the observed local Hα velocity dispersion. We then estimate
the total Hα luminosity by summing up the predicted pixel-by-pixel
surface brightnesses, and estimate σmean by weighting the
pixel-by-pixel velocity dispersion measurements by the Hα surface
brightnesses derived from the model.
Current usage metrics show cumulative count of Article Views (full-text article views including HTML views, PDF and ePub downloads, according to the available data) and Abstracts Views on Vision4Press platform.
Data correspond to usage on the plateform after 2015. The current usage metrics is available 48-96 hours after online publication and is updated daily on week days.
Initial download of the metrics may take a while.