Fig. 10
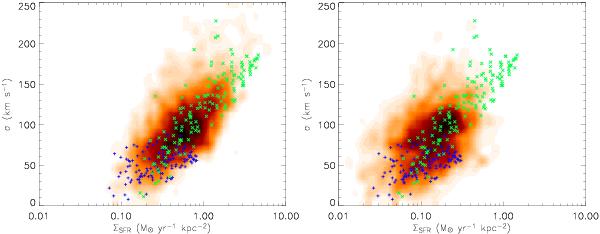
Plots of the normalized frequency of occurrence of Hα velocity dispersion versus star-formation intensity in two redshift bins, z < 1.8 (left) and z > 2 (right) (cf. Fig. 9 for the whole sample). The normalizations are different from that used in Fig. 9 and in the left and right panels. For both sub-samples, the average star-formation intensity of each galaxy was shifted to the average of its ensemble of galaxies (0.16 M⊙ yr-1 kpc-2 for z < 1.8 and 0.73 M⊙ yr-1 kpc-2 and z > 2). Note that the two sub-samples tend to sample different ranges in both velocity dispersion and star-formation intensity. The green × and blue + symbols represent our simulated data after beam smearing, assuming that the two quantities plotted are related as σ = (ϵΣSFR)1/2 km s-1 and σ = σsim, respectively. The green and blue model points have been shifted to overlap with the data (the location of the modeled points along the axis of ΣSFR is set by the coupling efficiency of the mechanical energy output of young stars to the ISM).
Current usage metrics show cumulative count of Article Views (full-text article views including HTML views, PDF and ePub downloads, according to the available data) and Abstracts Views on Vision4Press platform.
Data correspond to usage on the plateform after 2015. The current usage metrics is available 48-96 hours after online publication and is updated daily on week days.
Initial download of the metrics may take a while.