Fig. 9
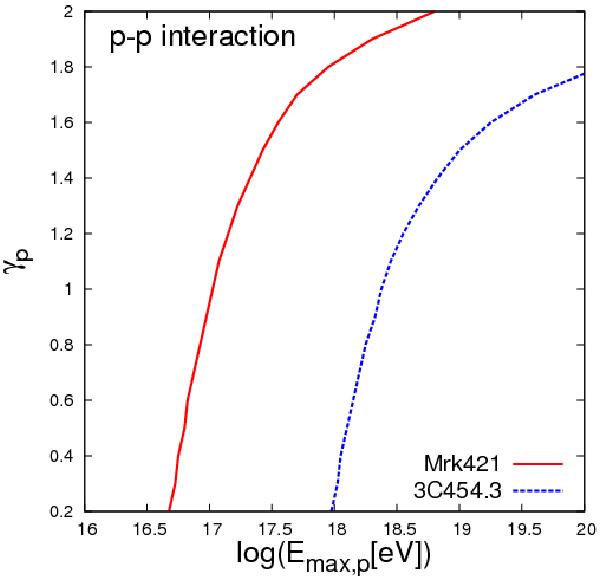
Constraints on (Emax,p,γp) deduced in the pp model (in the case of cascade dominated γ-ray spectrum). The excluded range of parameters is to the left and above each curve. The constrains obtained for the source Mrk 421 lie on the top and the one for 3C 454.3 lie on the bottom.
Current usage metrics show cumulative count of Article Views (full-text article views including HTML views, PDF and ePub downloads, according to the available data) and Abstracts Views on Vision4Press platform.
Data correspond to usage on the plateform after 2015. The current usage metrics is available 48-96 hours after online publication and is updated daily on week days.
Initial download of the metrics may take a while.