Fig. 6
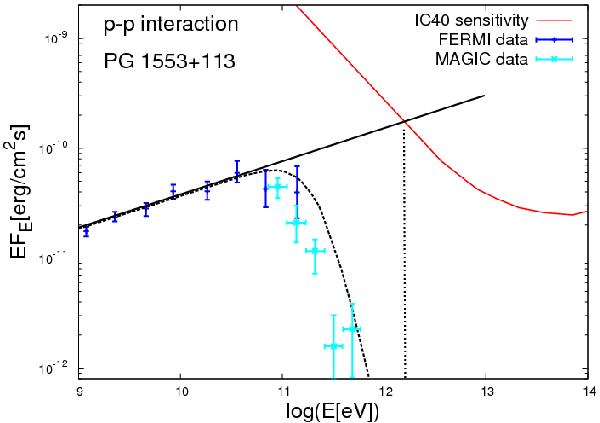
γ-ray spectrum of PG 1553+113 recorded by Fermi (blue data points) during the IC-40 observations, compared with the IC-40 sensitivity. Cyan points are MAGIC data from Albert et al. (2009). The red thick curve is the IC-40 sensitivity envelope. The vertical line shows the maximal energy to which the powerlaw type neutrino spectrum could extend.
Current usage metrics show cumulative count of Article Views (full-text article views including HTML views, PDF and ePub downloads, according to the available data) and Abstracts Views on Vision4Press platform.
Data correspond to usage on the plateform after 2015. The current usage metrics is available 48-96 hours after online publication and is updated daily on week days.
Initial download of the metrics may take a while.