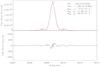
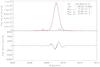
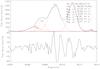
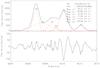
Fig. 8
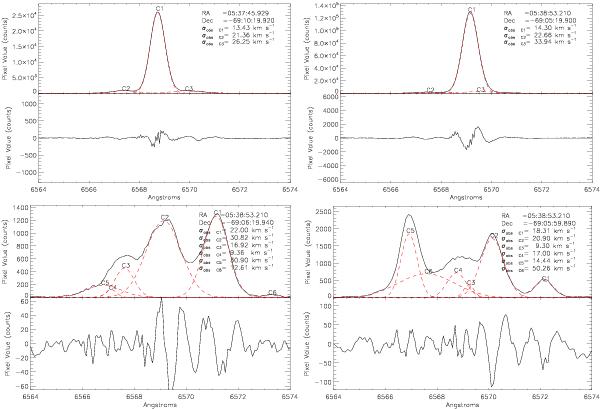
Multiple Gaussian fits to the Hα profiles in 30 Dor with the narrowest and broadest single-component velocity dispersions (upper and lower panels, respectively). The black (solid) and red (dashed) lines represent the observed and fitted profiles, respectively; each component is numbered. Residuals of the fits are shown below each fit, which are relatively minor when compared with the intensity of the profiles. In each panel we list the position of the spectra and the σobs of the different fitted components.
Current usage metrics show cumulative count of Article Views (full-text article views including HTML views, PDF and ePub downloads, according to the available data) and Abstracts Views on Vision4Press platform.
Data correspond to usage on the plateform after 2015. The current usage metrics is available 48-96 hours after online publication and is updated daily on week days.
Initial download of the metrics may take a while.