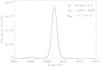
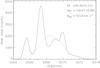
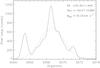
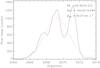
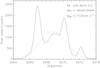
Fig. 7
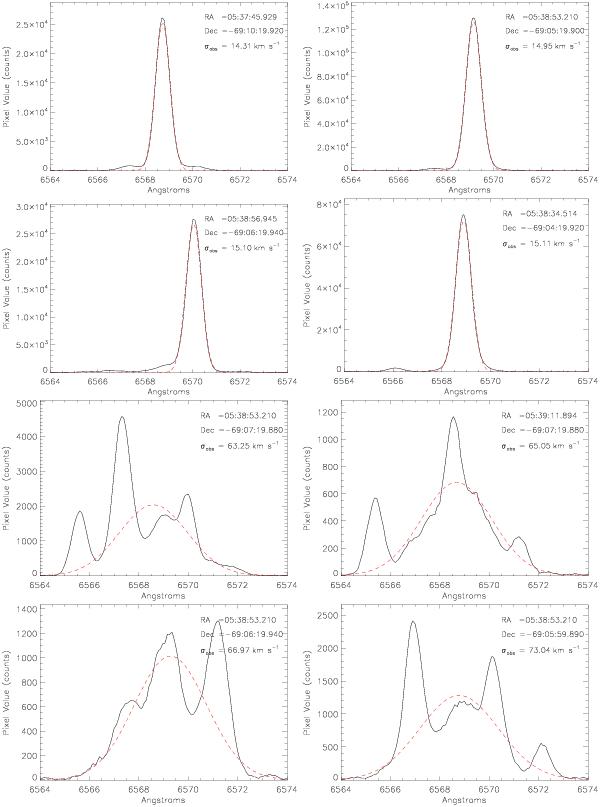
Examples of the different Hα morphologies detected in 30 Dor. In the first four panels we show the narrowest Hα profiles found in this study. In contrast, the last four panels show the broadest velocities arising from single-profile fits (which are clearly a consequence of multiple components in the observed lines). In each panel we note the coordinates of the observation and σobs of the single-profile Gaussian fit (indicated by the overplotted red dashed lines).
Current usage metrics show cumulative count of Article Views (full-text article views including HTML views, PDF and ePub downloads, according to the available data) and Abstracts Views on Vision4Press platform.
Data correspond to usage on the plateform after 2015. The current usage metrics is available 48-96 hours after online publication and is updated daily on week days.
Initial download of the metrics may take a while.