Fig. 5
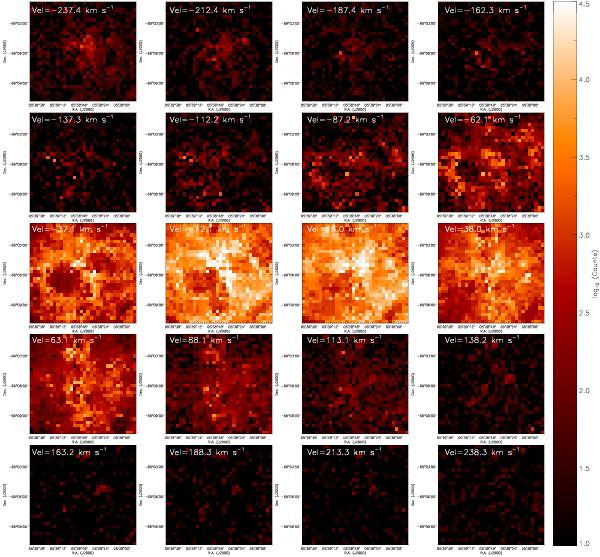
Velocity-sliced view of the 30 Dor datacube centered on the [Nii] λ6584 line. The velocity with respect to the center of the [Nii] λ6584 line is shown in the upper left-hand corner of each panel (negative and positive velocities imply radially approaching and receding velocities, respectively). In this figure, a logarithmic scale is used for the intensity of each map.
Current usage metrics show cumulative count of Article Views (full-text article views including HTML views, PDF and ePub downloads, according to the available data) and Abstracts Views on Vision4Press platform.
Data correspond to usage on the plateform after 2015. The current usage metrics is available 48-96 hours after online publication and is updated daily on week days.
Initial download of the metrics may take a while.