Fig. 3
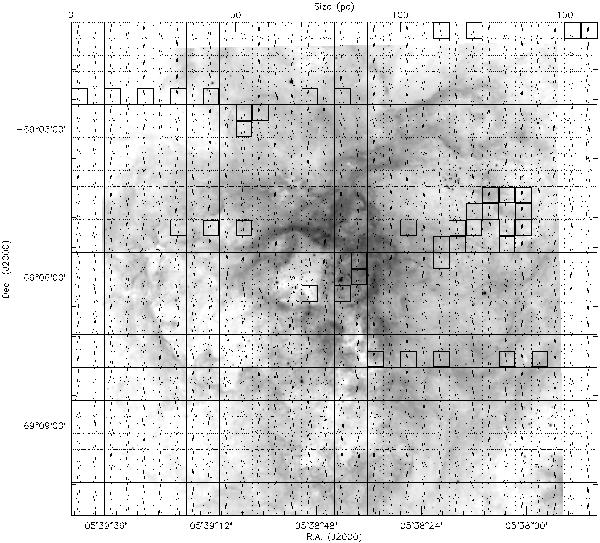
ESO/La Silla Hα image of 30 Dor (taken with the EMMI instrument), on which we have over-plotted the Hα profile from each fiber of the regular nebular grid. Each small box is 20′′ × 20′′ (5 pc × 5 pc), with the fibers located at the center of each box. Thick boxes indicate the positions for which we have interpolated the spectra (see Sect. 2.1.1).
Current usage metrics show cumulative count of Article Views (full-text article views including HTML views, PDF and ePub downloads, according to the available data) and Abstracts Views on Vision4Press platform.
Data correspond to usage on the plateform after 2015. The current usage metrics is available 48-96 hours after online publication and is updated daily on week days.
Initial download of the metrics may take a while.