Free Access
Fig. 2
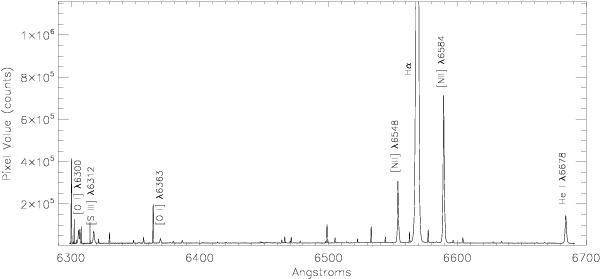
Integrated nebular spectrum of 30 Dor obtained from summing all of the spectra from the regular grid. The most intense emission line is Hα, but the intensity axis in the plot is truncated to show the low-intensity emission lines.
Current usage metrics show cumulative count of Article Views (full-text article views including HTML views, PDF and ePub downloads, according to the available data) and Abstracts Views on Vision4Press platform.
Data correspond to usage on the plateform after 2015. The current usage metrics is available 48-96 hours after online publication and is updated daily on week days.
Initial download of the metrics may take a while.