Fig. 12
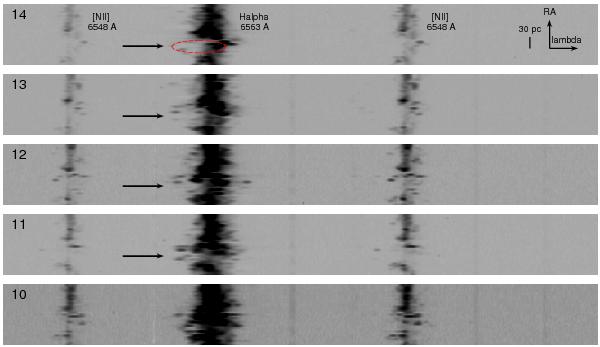
2D cut obtained from the spectroscopic datacube of 30 Doradus. These spectra correspond to rows 10, 11, 12, 13 and 14 from bottom to top (the numbers are indicated in the top left corner of each panel). The brightest lines correspond (from left-to-right) to [Nii] λ6548, Hα and [Nii] λ6584. The black arrows indicate the position of an expanding structure. As an example, the red-dashed ellipse indicates the location of this expanding structure in row #14.
Current usage metrics show cumulative count of Article Views (full-text article views including HTML views, PDF and ePub downloads, according to the available data) and Abstracts Views on Vision4Press platform.
Data correspond to usage on the plateform after 2015. The current usage metrics is available 48-96 hours after online publication and is updated daily on week days.
Initial download of the metrics may take a while.