Free Access
Fig. 10
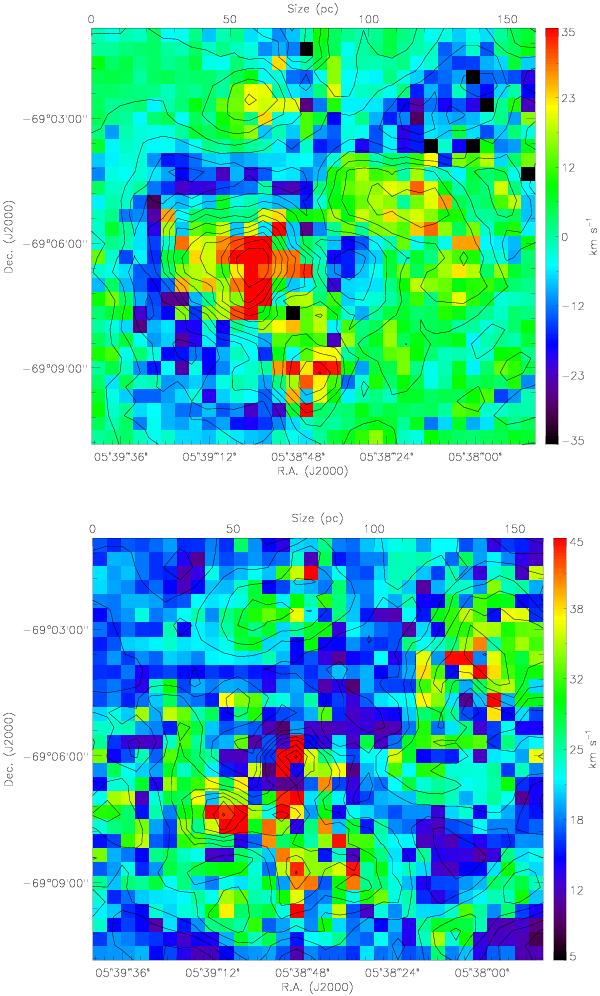
Radial line-of-sight systemic velocity map (upper panel) and velocity dispersion map (lower panel) of 30 Doradus from analysis of the Hα emission in the FLAMES spectra. North at the top and east to the left. The radial velocity map was corrected by the systemic velocity of 30 Dor.
This figure is made of several images, please see below:
Current usage metrics show cumulative count of Article Views (full-text article views including HTML views, PDF and ePub downloads, according to the available data) and Abstracts Views on Vision4Press platform.
Data correspond to usage on the plateform after 2015. The current usage metrics is available 48-96 hours after online publication and is updated daily on week days.
Initial download of the metrics may take a while.