Fig. 5
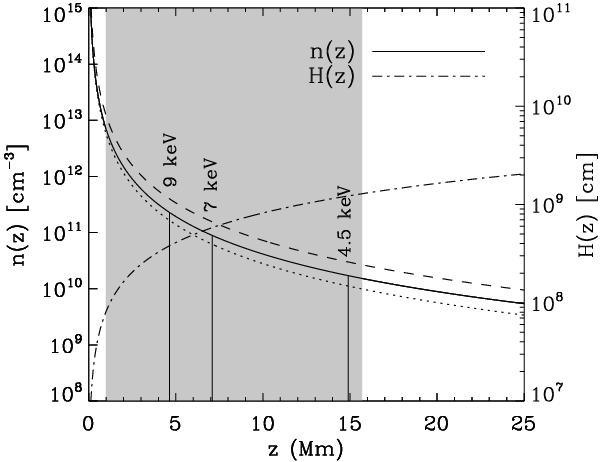
Density profile required to obtain the fits shown in Fig. 4. Density (n(z)) and local scale height (H(z)) versus height, z, above the footpoint are shown. The input parameters Hr, Nr, and a are the best-fit parameters resulting from the fitting process outlined in Fig. 4. Two alternate density models, which are derived from the alternate fits shown in Fig. 4, are given here as dashed and dotted lines. The shaded region represents the range of heights within which observations of HXR sources were made, and so densities and scale heights outside of this range are not expected to be accurate. It was assumed that the density structure of the flare plasma was approximately constant over the ~20 s rise phase of the HXRs. Vertical solid lines indicate the location of peak emission for the denoted energies, which represent the three energy bands used in this study. The values shown correspond to the first observation, where the injection spectral index is δ = 5.
Current usage metrics show cumulative count of Article Views (full-text article views including HTML views, PDF and ePub downloads, according to the available data) and Abstracts Views on Vision4Press platform.
Data correspond to usage on the plateform after 2015. The current usage metrics is available 48-96 hours after online publication and is updated daily on week days.
Initial download of the metrics may take a while.