Fig. 4
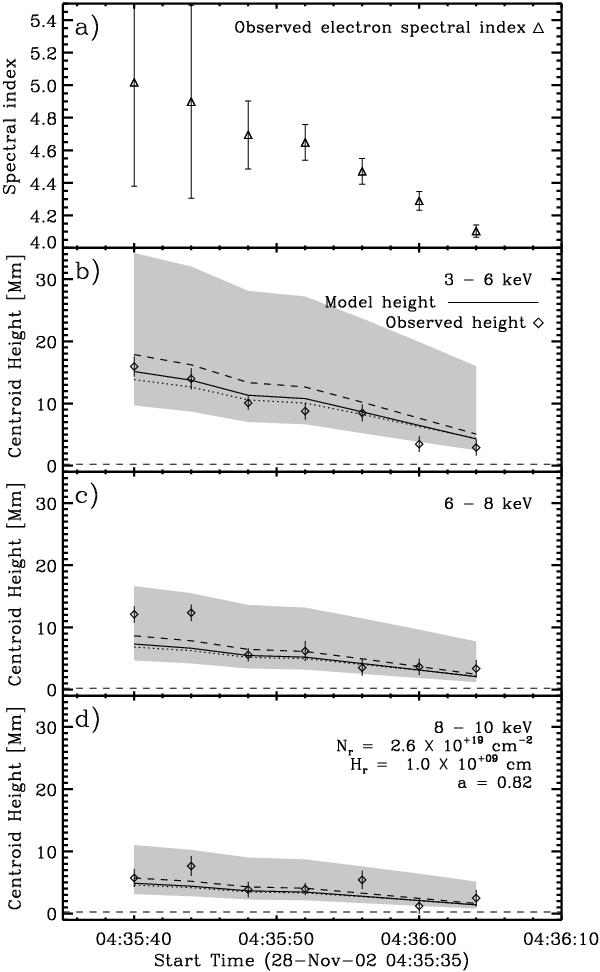
a) Electron spectral index, based on fits to RHESSI spectra. b)−d) Model and observed nonthermal source height evolutions for photon energies of 3–6 keV, 6–8 keV and 8–10 keV respectively. Source heights derived from RHESSI observations are denoted by diamonds, with vertical solid lines indicating the one-sigma width of the Gaussian which was fitted to the X-ray source. The heights corresponding to the peak in dI/dz are shown as a solid line. The shaded gray area extending above and below the solid line represents a one-sigma width of the model intensity distribution, calculated using its full width at half maximum, where FWHM = 2.35σ. This serves to demonstrate the size and asymmetry of the predicted X-ray source. Two alternate model height evolutions are shown as dashed and dotted lines, which use different fit parameters Nr, Hr, and a. Along with the model given by the solid line, these all produce minimal χ2 values when fit to the data. The alternative results are presented to show the range of possible fits to the data, with corresponding density models shown in Fig. 5. The dashed horizontal line represents the absolute height of the 25–50 keV footpoint, approximately 0.24 Mm. Fit parameters of the solid line are shown in d).
Current usage metrics show cumulative count of Article Views (full-text article views including HTML views, PDF and ePub downloads, according to the available data) and Abstracts Views on Vision4Press platform.
Data correspond to usage on the plateform after 2015. The current usage metrics is available 48-96 hours after online publication and is updated daily on week days.
Initial download of the metrics may take a while.