Fig. 3
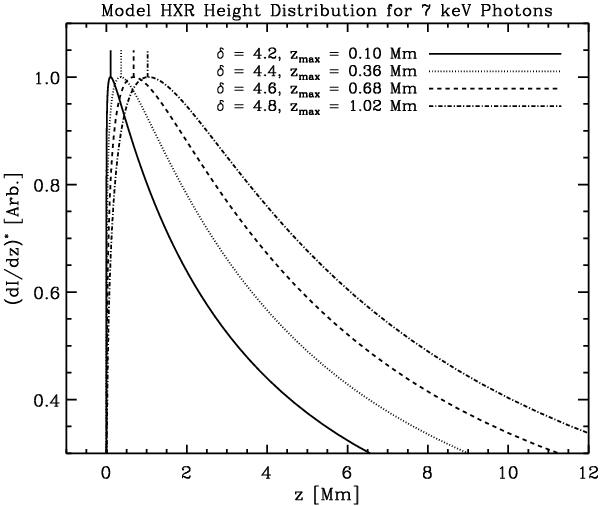
Modelled HXR flux distribution with distance from the footpoint along the flare loop, produced using Eqs. (4) and (5) and assuming example density parameters Hr = 109cm, Nr = 2.43 × 1019cm-2, and a = 0.9. Four sample spectral index values are input at a photon energy of 7 keV. Since z- and δ-independent factors are neglected, the distributions are normalised such that they peak at 1; however, the location of the peaks and the relative scaling between plots of different index are accurate. The height at which dI/dz distributions are at their maximum (zmax) is noted, illustrating the HXR source height’s dependence on spectral index. For lower spectral indices, the height at which dI/dz is at its maximum value is lower in the model flare loop.
Current usage metrics show cumulative count of Article Views (full-text article views including HTML views, PDF and ePub downloads, according to the available data) and Abstracts Views on Vision4Press platform.
Data correspond to usage on the plateform after 2015. The current usage metrics is available 48-96 hours after online publication and is updated daily on week days.
Initial download of the metrics may take a while.