Fig. 2
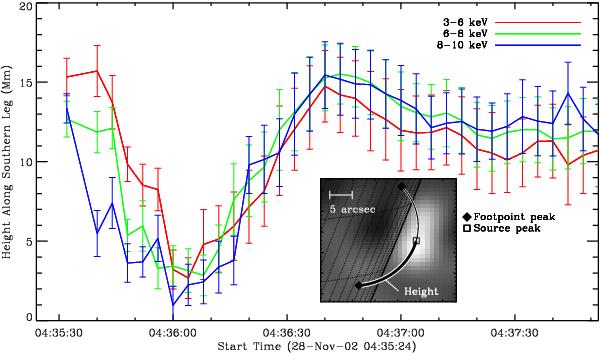
Height of X-ray source peak with time for the 3–6, 6–8, and 8–10 keV energy bands. Vertical lines represent the one-sigma width of the two-dimensional Gaussian which was fit to the RHESSI source to determine peak location. They illustrate the size of the source, which is sensitive to the point spread function (PSF) of the instrument. Height is defined as distance in megametres from the source peak to the southern footpoint along the circle defined by the source peak position itself and both footpoints (see inset). Footpoints are defined as the peak position of 25−50 keV emission at 04:36:08−04:36:12 UT, the peak in HXRs. The temporal spacing of the data points here does not represent the integration time of the associated RHESSI images. For all images but the first, the integration time is 8 s, while the spacing between them is 4 s, resulting in an overlap of 4 s. Inset: an example image of 3–6 keV emission at 04:35:40−04:35:48 UT. The source, just prior to splitting into two, can be seen to the right of the image, at the assumed looptop. Overlaid on the image are locations of the peaks of Gaussian fits to the current descending source (open square) and the 20–50 keV footpoints seen at the HXR peak (filled diamonds). The definition of height is visualised as the distance along the circle between the southern footpoint and the southern source.
Current usage metrics show cumulative count of Article Views (full-text article views including HTML views, PDF and ePub downloads, according to the available data) and Abstracts Views on Vision4Press platform.
Data correspond to usage on the plateform after 2015. The current usage metrics is available 48-96 hours after online publication and is updated daily on week days.
Initial download of the metrics may take a while.