Fig. 1
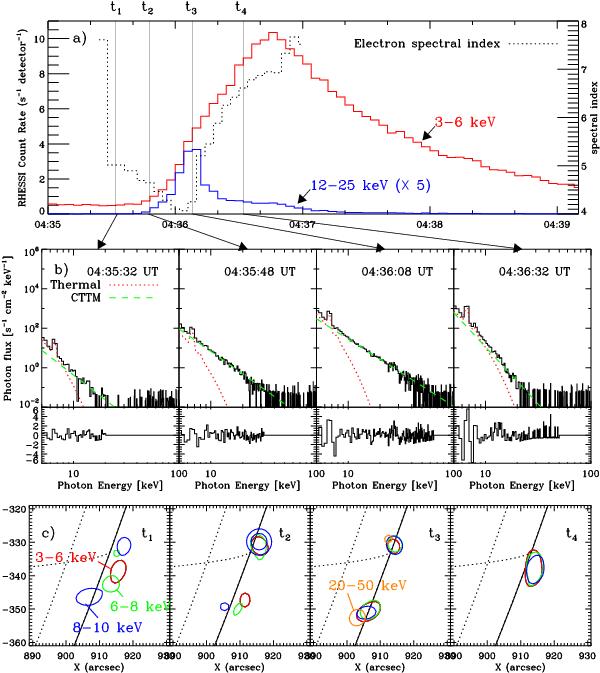
a) X-ray lightcurve of the flare of 28 November 2002. The 12–25 keV curve is scaled by a factor of five for clarity. Four times are marked, corresponding to the start times of the four images and spectra shown below. Overplotted is the electron power-law index derived from the spectral fits (dotted line), demonstrating the concurrence of maximum spectral hardness (minimum spectral index) with peak in HXR emission. b) Spatially integrated spectra for the times of their corresponding images using pre-flare background subtraction. Overlaid are thermal and nonthermal fits constructed using the OSPEX spectral analysis suite. Residuals, or the difference between observed and model-based X-ray flux, normalized to the one-sigma uncertainty in the photon flux, are plotted below each spectrum. c) RHESSI image contours corresponding to energy bands of 3–6, 6–8, and 8–10 keV, with a contour showing 20–50 keV at t3, the HXR peak. Contours represent 75% of the peak emission of the image, with a second 50% contour included for the 8–10 keV image at interval t2, in order to show the location of the southern source. Images are generated using the CLEAN algorithm available in the RHESSI image analysis software. Each of the intervals used for these images are eight second in duration, beginning at the time shown in b).
Current usage metrics show cumulative count of Article Views (full-text article views including HTML views, PDF and ePub downloads, according to the available data) and Abstracts Views on Vision4Press platform.
Data correspond to usage on the plateform after 2015. The current usage metrics is available 48-96 hours after online publication and is updated daily on week days.
Initial download of the metrics may take a while.