Fig. 1
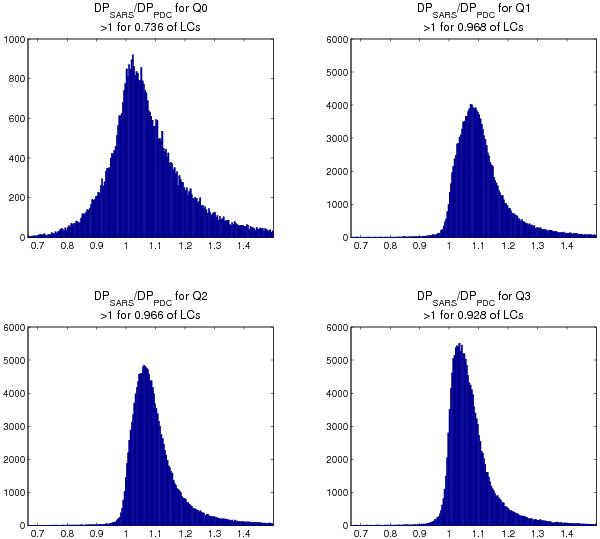
Distribution of the ratio of detection power metrics (DP, see text for definition)  for quarters 0 through 3 (quarters 4, 5 and 6 are very similar to Q1 and Q2). The anomalously short Q0 is exceptionally underperforming but there too SARS has higher DP than PDC for ~3/4 of the data. For the sake of clarity we present only the range between 2/3 and 1.5 (representing a performance difference of 50% in each direction).
Current usage metrics show cumulative count of Article Views (full-text article views including HTML views, PDF and ePub downloads, according to the available data) and Abstracts Views on Vision4Press platform.
Data correspond to usage on the plateform after 2015. The current usage metrics is available 48-96 hours after online publication and is updated daily on week days.
Initial download of the metrics may take a while.