Fig. 13
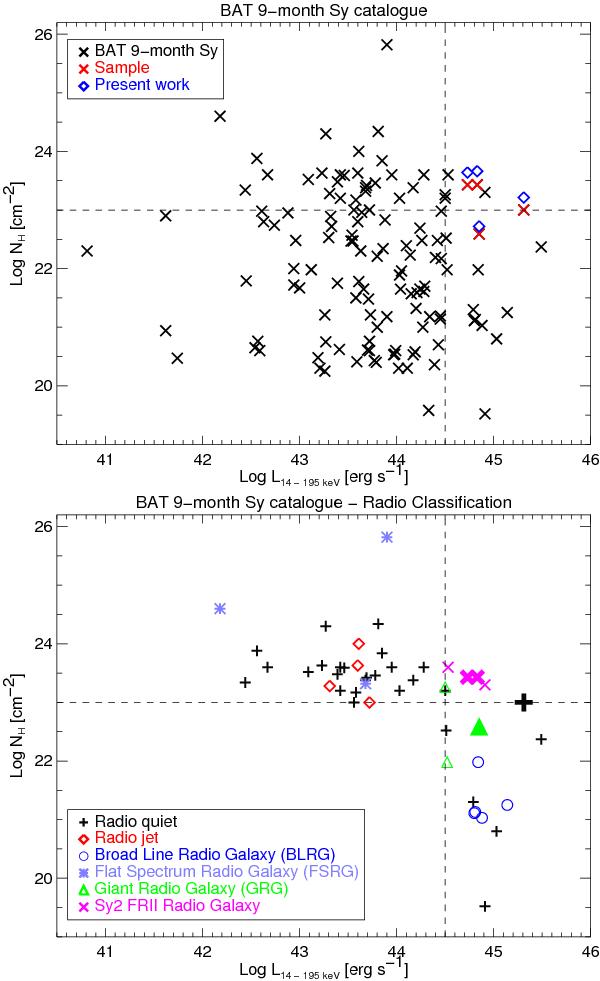
Top panel: the distribution in column density (NH) and BAT 14−195 keV luminosity of the BAT nine-month survey Seyfert galaxies as given by Tueller et al. (2008). The red crosses and blue diamonds represent our sample column density from the BAT survey and the Suzaku analysis. Bottom panel: the BAT nine-month Seyferts subsample is defined by Log NH ≥ 23 and/or Log L14 − 195 keV ≥ 44.5 (dashed lines), i.e., the most luminous and absorbed sources are selected. The symbols refer to the radio type as classified from the literature, the thicker symbols indicate the present sample.
Current usage metrics show cumulative count of Article Views (full-text article views including HTML views, PDF and ePub downloads, according to the available data) and Abstracts Views on Vision4Press platform.
Data correspond to usage on the plateform after 2015. The current usage metrics is available 48-96 hours after online publication and is updated daily on week days.
Initial download of the metrics may take a while.