Fig. 16
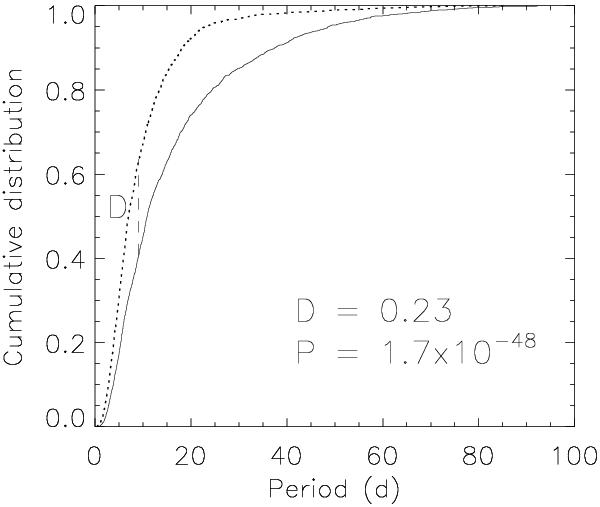
Cumulative distributions of the variability period for the entire sample analyzed in the top panel of Fig. 15. Distributions are compared for Galactic center (solid line) and anti-center (dotted line) using the Kolmogorov-Smirnov (KS) test. Distance (D) and probability (P) calculated in the KS test are shown in the figure.
Current usage metrics show cumulative count of Article Views (full-text article views including HTML views, PDF and ePub downloads, according to the available data) and Abstracts Views on Vision4Press platform.
Data correspond to usage on the plateform after 2015. The current usage metrics is available 48-96 hours after online publication and is updated daily on week days.
Initial download of the metrics may take a while.