Free Access
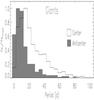
Fig. 15
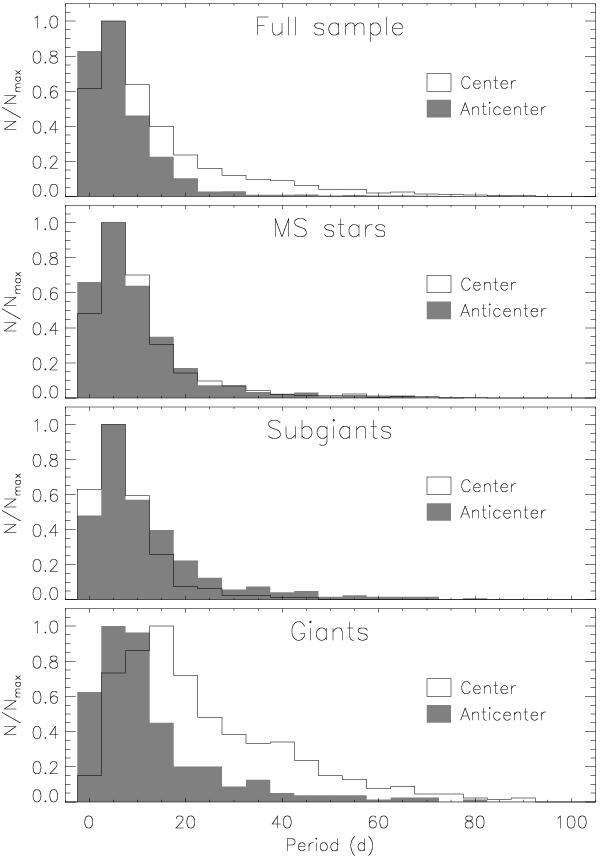
Distributions of the variability period in the sample described in Sect. 2. Distributions are normalized with respect to their maxima and are compared for the Galactic center and anti-center in accordance with the symbols in the legend. From top to bottom: full sample, main-sequence stars, subgiants, and giants.
This figure is made of several images, please see below:
Current usage metrics show cumulative count of Article Views (full-text article views including HTML views, PDF and ePub downloads, according to the available data) and Abstracts Views on Vision4Press platform.
Data correspond to usage on the plateform after 2015. The current usage metrics is available 48-96 hours after online publication and is updated daily on week days.
Initial download of the metrics may take a while.