Fig. 13
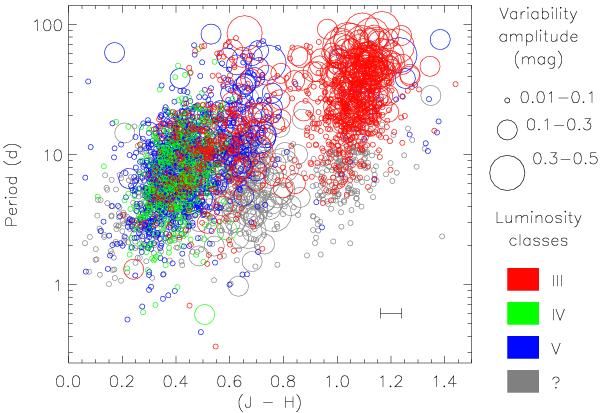
Color–period diagram without reddening correction, demonstrating the variability period as a function of the color index (J − H) for the final sample described in Sect. 2. Circle size indicates the variability amplitude in mag and colors represent the luminosity class. The typical error of (J − H) is displayed in the error bar.
Current usage metrics show cumulative count of Article Views (full-text article views including HTML views, PDF and ePub downloads, according to the available data) and Abstracts Views on Vision4Press platform.
Data correspond to usage on the plateform after 2015. The current usage metrics is available 48-96 hours after online publication and is updated daily on week days.
Initial download of the metrics may take a while.