Fig. 9
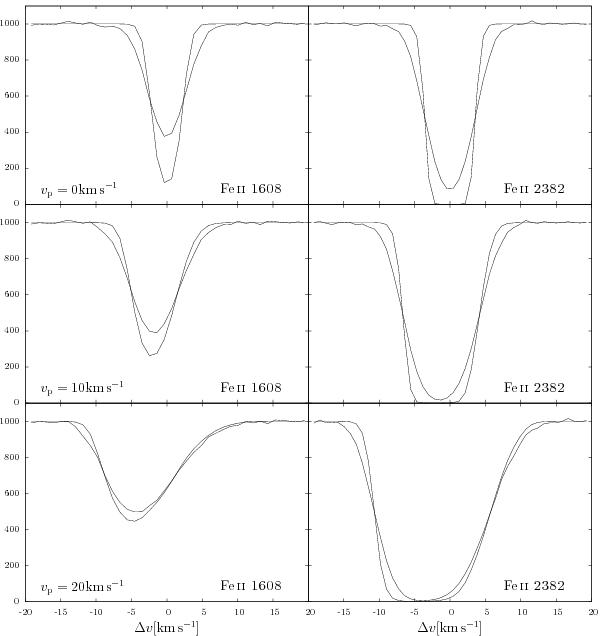
Simulated spectra of gas with an underlying velocity field according to Fig. 7 with N2 = 13.5. The peak velocities are vp = 0 km s-1, vp = 10 km s-1 and vp = 20 km s-1. The different curves show the flux before and after convolution with the instrument profile. Saturated version.
Current usage metrics show cumulative count of Article Views (full-text article views including HTML views, PDF and ePub downloads, according to the available data) and Abstracts Views on Vision4Press platform.
Data correspond to usage on the plateform after 2015. The current usage metrics is available 48-96 hours after online publication and is updated daily on week days.
Initial download of the metrics may take a while.