Fig. 16
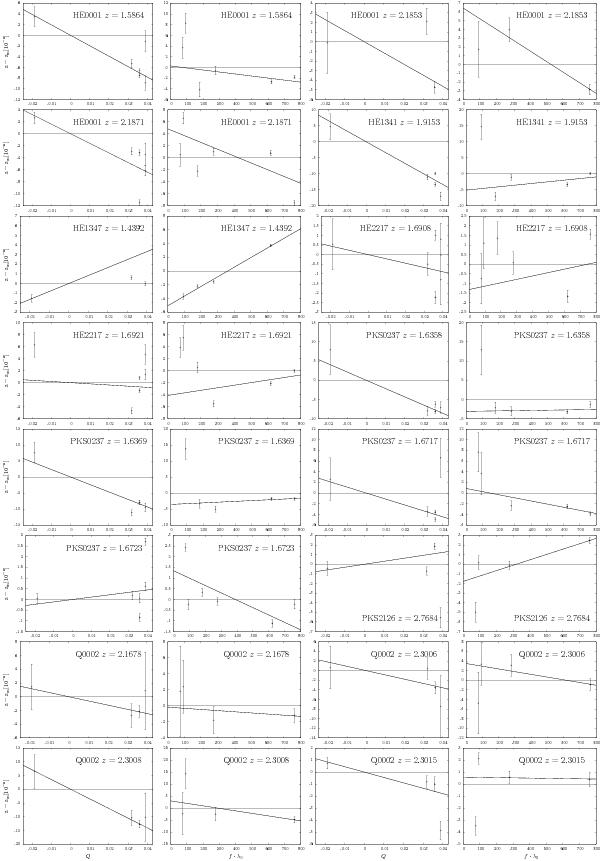
Line shift analysis of 16 Fe ii systems in eight quasar spectra. The relative position shift is plotted against the sensitivity coefficient Q and the transition strength fλ0 for each system. zm is the intercept term of the depicted regression.
Current usage metrics show cumulative count of Article Views (full-text article views including HTML views, PDF and ePub downloads, according to the available data) and Abstracts Views on Vision4Press platform.
Data correspond to usage on the plateform after 2015. The current usage metrics is available 48-96 hours after online publication and is updated daily on week days.
Initial download of the metrics may take a while.