Fig. 7
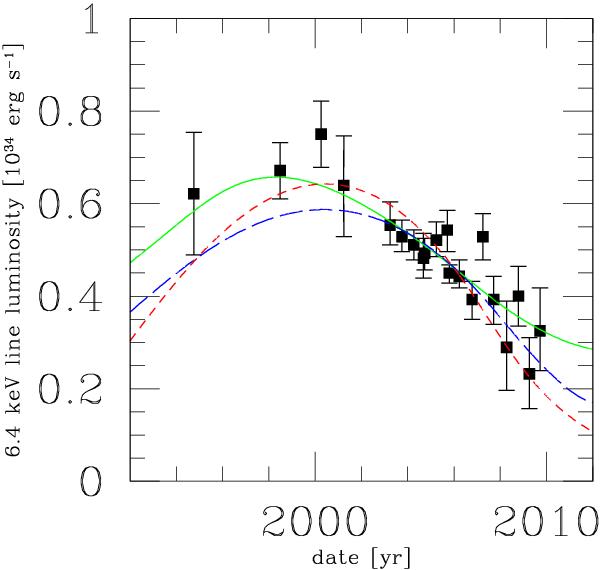
The preferred description of the time dependence of Fe Kα declining luminosity of the B2 cloud. (i) Short-dashed (red) line: the best fit for constant density model of the cloud; (ii) long-dashed (blue) line: two-component constant density model of the core and envelope; (iii) thick continuous (green) line: dense core with a radially decreasing density of the envelope. This final model gives the most precise representation of the data and also seems to describe the most realistic situation.
Current usage metrics show cumulative count of Article Views (full-text article views including HTML views, PDF and ePub downloads, according to the available data) and Abstracts Views on Vision4Press platform.
Data correspond to usage on the plateform after 2015. The current usage metrics is available 48-96 hours after online publication and is updated daily on week days.
Initial download of the metrics may take a while.