Fig. 5
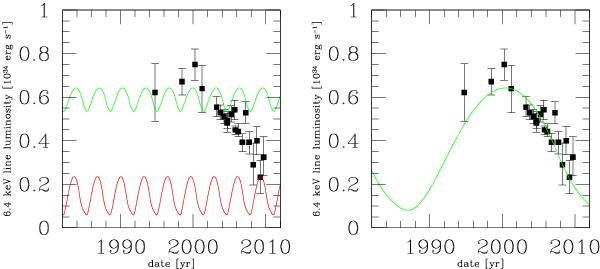
Test examples of the time dependence of the iron Kα reflection spectral line flux from the model of Sgr B2 cloud reprocessing (continuous lines), together with the data points from Yu et al. (2011; shown by squares and the corresponding measurement error bars). The constant density model was used with parameters as follows. Left panel: the accretion model as in the top-left panel of Fig. 4, Rcloud = 0.25 pc (red line) and Rcloud = 0.50 pc (green line); obviously this example does not produce a reasonable solution because either frequency or the amplitude of oscillations do not correspond with the data. Right panel: as in the bottom-right panel of Fig. 4, Rcloud = 2.3 pc; the latter example provides significantly better agreement with the data for which the formal χ2 test converges to an acceptable fit.
Current usage metrics show cumulative count of Article Views (full-text article views including HTML views, PDF and ePub downloads, according to the available data) and Abstracts Views on Vision4Press platform.
Data correspond to usage on the plateform after 2015. The current usage metrics is available 48-96 hours after online publication and is updated daily on week days.
Initial download of the metrics may take a while.