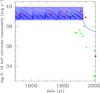
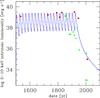
Fig. 4
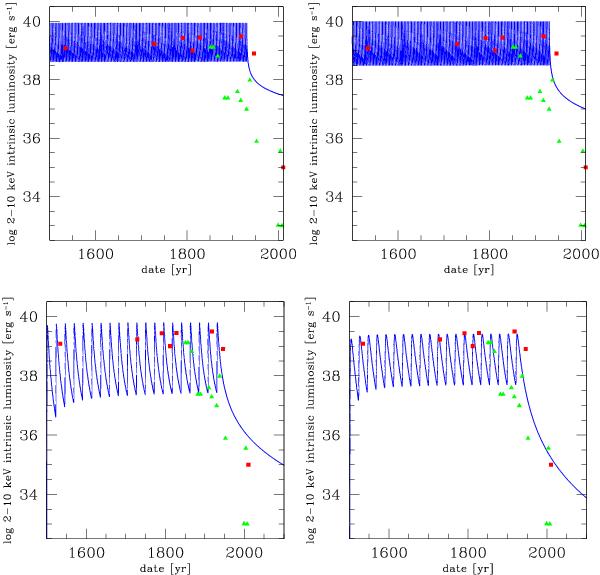
Four cases of the predicted luminosity history for different values of the model parameters representing the decay and the variability level with a reasonable mean luminosity and the range in its variation. Constraining data values are shown by red squares (based on X-ray data from Ryu et al. (2013), plotted here without the errorbars) and green triangles (based on Capelli et al. 2012). The model lightcurves are plotted by a blue continuous curve. The interplay of model parameters determines the level of mean luminosity, frequency of the oscillations, and the rate of final decline at the moment when the accretion ceases. Top-left panel: Mtot = 0.1 M⊙, tvisc = 0.24 yr, N = 200, μ = 2/3, η = 10-3, ηX = 0.1. Top-right panel: Mtot = 0.1 M⊙, tvisc = 0.24 yr, N = 200, μ = 2/3, η = 10-3, ηX from Eq. (16). Bottom-left panel: Mtot = 0.025 M⊙, tvisc = 3 yr, N = 20, μ = 2/3. Bottom-right panel: Mtot = 0.075 M⊙, tvisc = 3 yr, N = 20, μ = 1.3. In the last two cases, η was determined from Eq. (14) and ηX from Eq. (16).
Current usage metrics show cumulative count of Article Views (full-text article views including HTML views, PDF and ePub downloads, according to the available data) and Abstracts Views on Vision4Press platform.
Data correspond to usage on the plateform after 2015. The current usage metrics is available 48-96 hours after online publication and is updated daily on week days.
Initial download of the metrics may take a while.