Free Access
Fig. 2
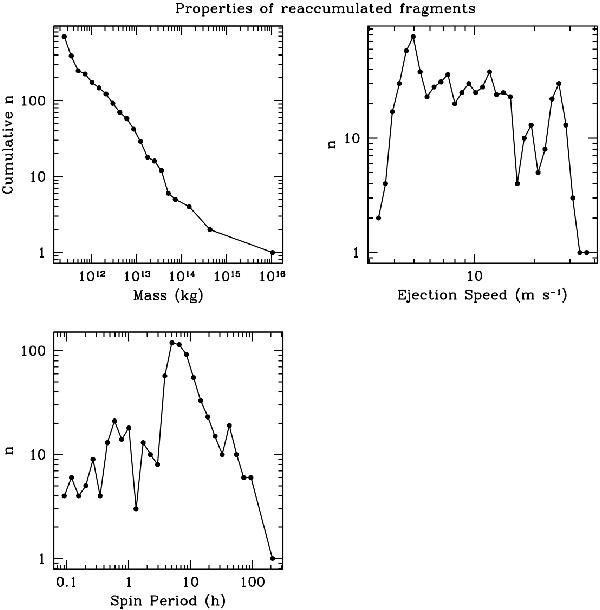
Cumulative size distribution (top left), distribution of ejection speeds (top right), and distribution of spin periods (bottom left) of the full set of fragments and aggregates formed by the catastrophic disruption of a 25 km diameter body.
Current usage metrics show cumulative count of Article Views (full-text article views including HTML views, PDF and ePub downloads, according to the available data) and Abstracts Views on Vision4Press platform.
Data correspond to usage on the plateform after 2015. The current usage metrics is available 48-96 hours after online publication and is updated daily on week days.
Initial download of the metrics may take a while.