Fig. 3
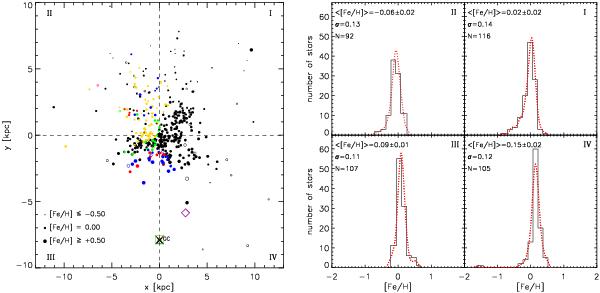
Left – Distribution onto the Galactic plane of Cepheids with accurate iron abundances. Symbols and colors are the same as in Fig. 2. The size of the circles scales with their iron abundances (see labeled values). The bulge fields were not plotted, since we lack individual distances. The dashed lines display the position of the Sun, while the cross the position of the Galactic center. Right – Metallicity distribution of the Cepheids in the four quadrants. The solid black line shows the histogram (bin size = 0.15 dex). The dotted red line shows the smoothed metallicity distribution estimated running a Gaussian kernel with fixed σ = 0.1 dex. The adopted dispersion accounts for errors on abundances and uncertainties in the different samples. The number of Cepheids, the mean and the σ of the Gaussian fit are also labeled.
Current usage metrics show cumulative count of Article Views (full-text article views including HTML views, PDF and ePub downloads, according to the available data) and Abstracts Views on Vision4Press platform.
Data correspond to usage on the plateform after 2015. The current usage metrics is available 48-96 hours after online publication and is updated daily on week days.
Initial download of the metrics may take a while.