Fig. 2
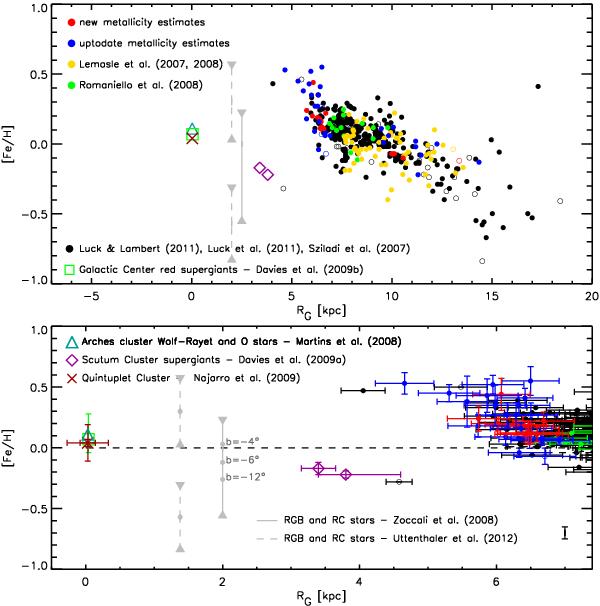
Top – Iron abundance of Galactic classical Cepheids versus Galactocentric distance. Spectroscopic measurements based on different data sets are plotted with different colors. New iron abundances based on current UVES spectra (16, red), update iron abundances based on UVES spectra (31, blue); iron abundances provided by our group: Lemasle et al. (2008), Lemasle et al. (2007) (57, yellow), Romaniello et al. (2008) (16, green); iron abundances available in the literature: Luck et al. (2011), Luck & Lambert (2011), and Sziládi et al. (2007) (300, black). Cepheids that according to the General Catalog of Variable Stars (Samus et al. 2009) are candidate classical Cepheids were plotted with open circles. The vertical gray bars located at arbitrary Galactocentric distances – RG ~ 2 kpc – show the mean (±1σ) iron abundance for Galactic bulge stars: the solid line is located at the mean metallicity of the sample provided by Zoccali et al. (2008); the dashed lines are located at the mean values (±1σ) found by Uttenthaler et al. (2012). The range in metallicity is 1σ. The green square marks the iron abundance of the two red supergiants in the Galactic center measured by Davies et al. (2009a), while the magenta diamonds the 26 red supergiants in the Scutum Cluster measured by Davies et al. (2009b), the red cross the two luminous blue variables (LBVs) in the Quintuplet cluster (Najarro et al. 2009) and the light-blue triangle three Wolf-Rayet and two O-type stars in the Arches cluster (Martins et al. 2008). Bottom – Same as the top, but for Galactocentric distances smaller than the solar circle (RG ≤ 7.5 kpc). The bars on individual Cepheids display the uncertainty on both iron abundance and distance. The vertical black bar on the bottom right corner shows the mean uncertainty on Luck & Lambert (2011) and Romaniello et al. (2008) iron abundances. The gray vertical lines are the same of the top panel; the filled circles on the solid line display the mean iron abundance of the bulge fields located at b = − 4°, (⟨[Fe/H]⟩ = + 0.03 ± 0.38), b = − 6°, (⟨[Fe/H]⟩ = − 0.12 ± 0.35), and at b = − 12°, (⟨ [Fe/H] ⟩ = − 0.26 ± 0.40) observed by Zoccali et al. (2008). The filled circles on the dashed lines display the mean metallicities provided by Uttenthaler et al. (2012) for stars located at b = − 10°, (⟨[Fe/H]⟩ = − 0.57 ± 0.27 and ⟨[Fe/H]⟩ = + 0.30 ± 0.28).
Current usage metrics show cumulative count of Article Views (full-text article views including HTML views, PDF and ePub downloads, according to the available data) and Abstracts Views on Vision4Press platform.
Data correspond to usage on the plateform after 2015. The current usage metrics is available 48-96 hours after online publication and is updated daily on week days.
Initial download of the metrics may take a while.